
# rpm包安装
# elasticsearch
https://www.elastic.co/guide/en/elasticsearch/reference/6.0/rpm.html
sudo rpm --install elasticsearch-8.8.2-x86_64.rpm
jvm.options
-Xms512m
-Xmx512m
elasticsearch.yml
# filebeat
sudo rpm -ivh filebeat-7.0.0-x86_64.rpm
配置文件目录: cd /etc/filebeat/
启动
sudo systemctl start|restart|stop filebeat
源码方式使用
下载相同版本的源码包: 8.2.3
下载地址: https://www.elastic.co/cn/downloads/
├── elasticsearch-8.2.3-linux-x86_64.tar.gz
├── elasticsearch-analysis-ik-8.2.3.zip
├── filebeat-8.2.3-linux-x86_64.tar.gz
├── kibana-8.2.3-linux-x86_64.tar.gz
├── logstash-8.2.3-linux-x86_64.tar.gz
├── logstash-filter-geoip-7.2.12.tar.gz
└── metricbeat-8.2.3-linux-x86_64.tar.gz
# Elasticsearch
解压
tar -zxvf Package/elasticsearch-8.2.3-linux-x86_64.tar.gz -C ./
修改配置:elasticsearch.yml
cluster.name: elasticsearch
node.name: master
network.host: 0.0.0.0
http.port: 9200
cluster.initial_master_nodes: ['mster']
修改配置: /etc/systemctl.conf
vm.max_map_count=655360
启动
./es/bin/elasticsearch
访问:http://localhost:9200
# elasticsearch设置用户密码
1、修改 elasticsearch.yml 文件
xpack:
  license.self_generated.type: basic
  security:
    enabled: true # 开启密码设置为 true
    enrollment:
      enabled: true
  transport:
   	 ssl:
   	   enabled: false
2、执行设置用户名和密码的命令,这里需要为4个用户分别设置密码,elastic, kibana, logstash_system,beats_system
./bin/elasticsearch-setup-passwords auto
3,修改密码命令如下
curl -H "Content-Type:application/json" -XPOST -u elastic 'http://127.0.0.1:9200/_xpack/security/user/elastic/_password' -d '{ "password" : "new password" }'
# 忘记密码
进入docker环境中,创建一个 超级用户 :admin
./bin/elasticsearch-users useradd admin -r superuser
用这个用户去修改elastic的密码:
curl -XPUT -u admin:admin666 http://localhost:9200/_xpack/security/user/elastic/_password -H "Content-Type: application/json" -d '
{
  "password": "new password"
}'
#
# filebeat
日志文件(收集文件数据)
filebeat.prospectors:
 - input_type: log
   paths:
  - /nginx/*.log
  - /mysql/*.log
 - input_type: stdin # 标椎输入
   paths:
   - /redis/*.log

output.console:
  pretty: true

output.elasticsearch:
 hosts: ["127.0.0.1:9200"]
 username: "admin"
 password: "admin666"
# 安装
下载解压即可,已下操作都是在filebeat目录下进行操作
tar -zxvf filebeat-8.4.3-linux-x86_64.tar.gz
cd filebeat-8.4.3-linux-x86_64/
# 初体验
读取一个文件在终端中输出
配置文件
demo.yaml

filebeat.inputs:
  - type: stdin
    enabled: true
setup.template.settings: # 保存到es中的一个副本的数量
    index.number_of_shards: 1

output.console:
    pretty: true
    enable: true
运行
./filebeat -e -c demo.yaml
# 读取日志文件
创建一个日志文件
mkdir Logs

touch nginx.log
创建一个 nginx-log.yml 文件
# nginx-log.yml

filebeat.inputs: # 这里是inputs
  - type: log # 类型是 日志类型
    enabled: true
    paths:
      - /path/to/logs/*.log
    fileds: # 添加自定义字段
      from: nginx-log
      log_type: access
    fileds_under_root: true # 添加到根节点,false:添加到子节点
setup.template.settings:
  index.number_of_shards: 3

# 输出到终端
output.console:
  pretty: true
  enable: true
启动
./filebeat -e- c filebeat-log.yaml
/path/to/logs/a.log
hello
world
# 输出到elasticsearch中
# filebeat-nginx.yaml
filebeat.input:
  - type: log
    enabled: true
    paths:
      - /path/to/logs/*.log
    tags: ["nginx","log"]
    fileds:
      from: "nginx-log"
      fields_under_root: false
setup.template.settings:
  index.number_of_shards: 3

# 输入到es中
output.elasticsearch: # 制定es的配置
  hosts: ["127.0.0.1:9200"]
  username: ""
  password: ""

# 输出到 kibana 汇总
setup.kibana:
  host: "kibana_host:5601"
启动
./filebeat -e- c filebeat-nginx.yaml
# 实战演示
将宝塔中nginx的日志通过filebeat 输出到 elasticsearch中,并用kibana展示出来。
# 1、开启nginx modules
./filebeat modules enable nginx

# 列表
./filebeat modules list

# 开启禁用
./filebeat modules enable|disable nginx
# 3、填写配置nginx日志路径
vim cd modules.d/nginx.yml
# Module: nginx
# Docs: https://www.elastic.co/guide/en/beats/filebeat/8.4/filebeat-module-nginx.html

- module: nginx
  # Access logs
  access:
    enabled: true
    # nginx access_log 的绝对路径,可填写多个
    var.paths: ["/home/orangbus/Docker/Logs/deepin.com.log"]

  # Error logs
  error:
    enabled: false
    # 同上配置
    #var.paths:

  ingress_controller:
    enabled: false

    #var.paths:
# 3 、配置 filebeat-nginx.yml
参考地址:https://www.elastic.co/guide/en/beats/filebeat/current/setup-kibana-endpoint.html
创建一个 nginx-filebeat.yml 配置 (复制一份默认的进行修改)
cp cp filebeat.yml nginx-filebeat.yml
filebeat.input:

setup.template.settings:
  index.number_of_shards: 1

# kibana 配置
setup.kibana:
  host: "localhost:5601"
  protocol: "http"
  username: "elastic"
  password: "cy2ZEszz8EP0gPy6hi9L" # es的认证账号密码

# elasticsearch的配置
output.elasticsearch:
  hosts: ["127.0.0.1:9200"]
  username: "elastic"
  password: "93Wzawo0wunszVmc1gwa"
可能需要安装两个elasticsearch扩展包
sudo bin/elasticsearch-plugin install ingest-user-agent
sudo bin/elasticsearch-plugin install ingest-geoip
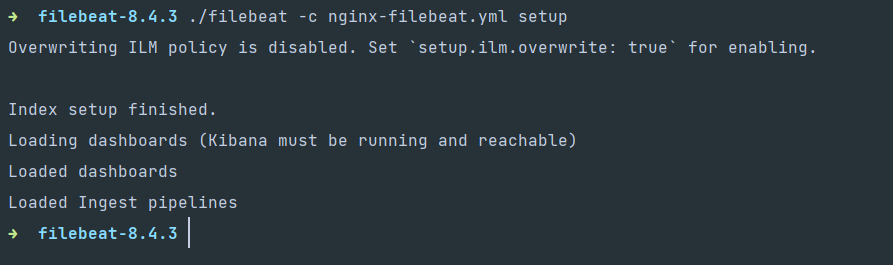
# 4、安装仪表盘到kibana中
./filebeat -c nginx-filebeat.yml setup
# 5、运行
./filebeat -e- c nginx-filebeat.yml

// 后台启动
./filebeat -e- c nginx-filebeat.yml  2>&1 >/dev/null &

nohup /home/orangbus/Docker/elastic/filebeat-8.7.0/filebeat -e -c /home/orangbus/Docker/elastic/filebeat-8.7.0/filebeat.yml > /dev/null 2>&1 &

// 查看
ps -ef | grep filebeat
sudo vi /etc/systemd/system/filebeat.service

[Unit]
Description=Elasticsearch Filebeat
Documentation=https://www.elastic.co/products/beats/filebeat
Wants=network-online.target
After=network-online.target

[Service]
User=filebeat
Group=filebeat
ExecStart=/usr/bin/filebeat -c /path/to/filebeat.yml
Restart=always

[Install]
WantedBy=multi-user.target
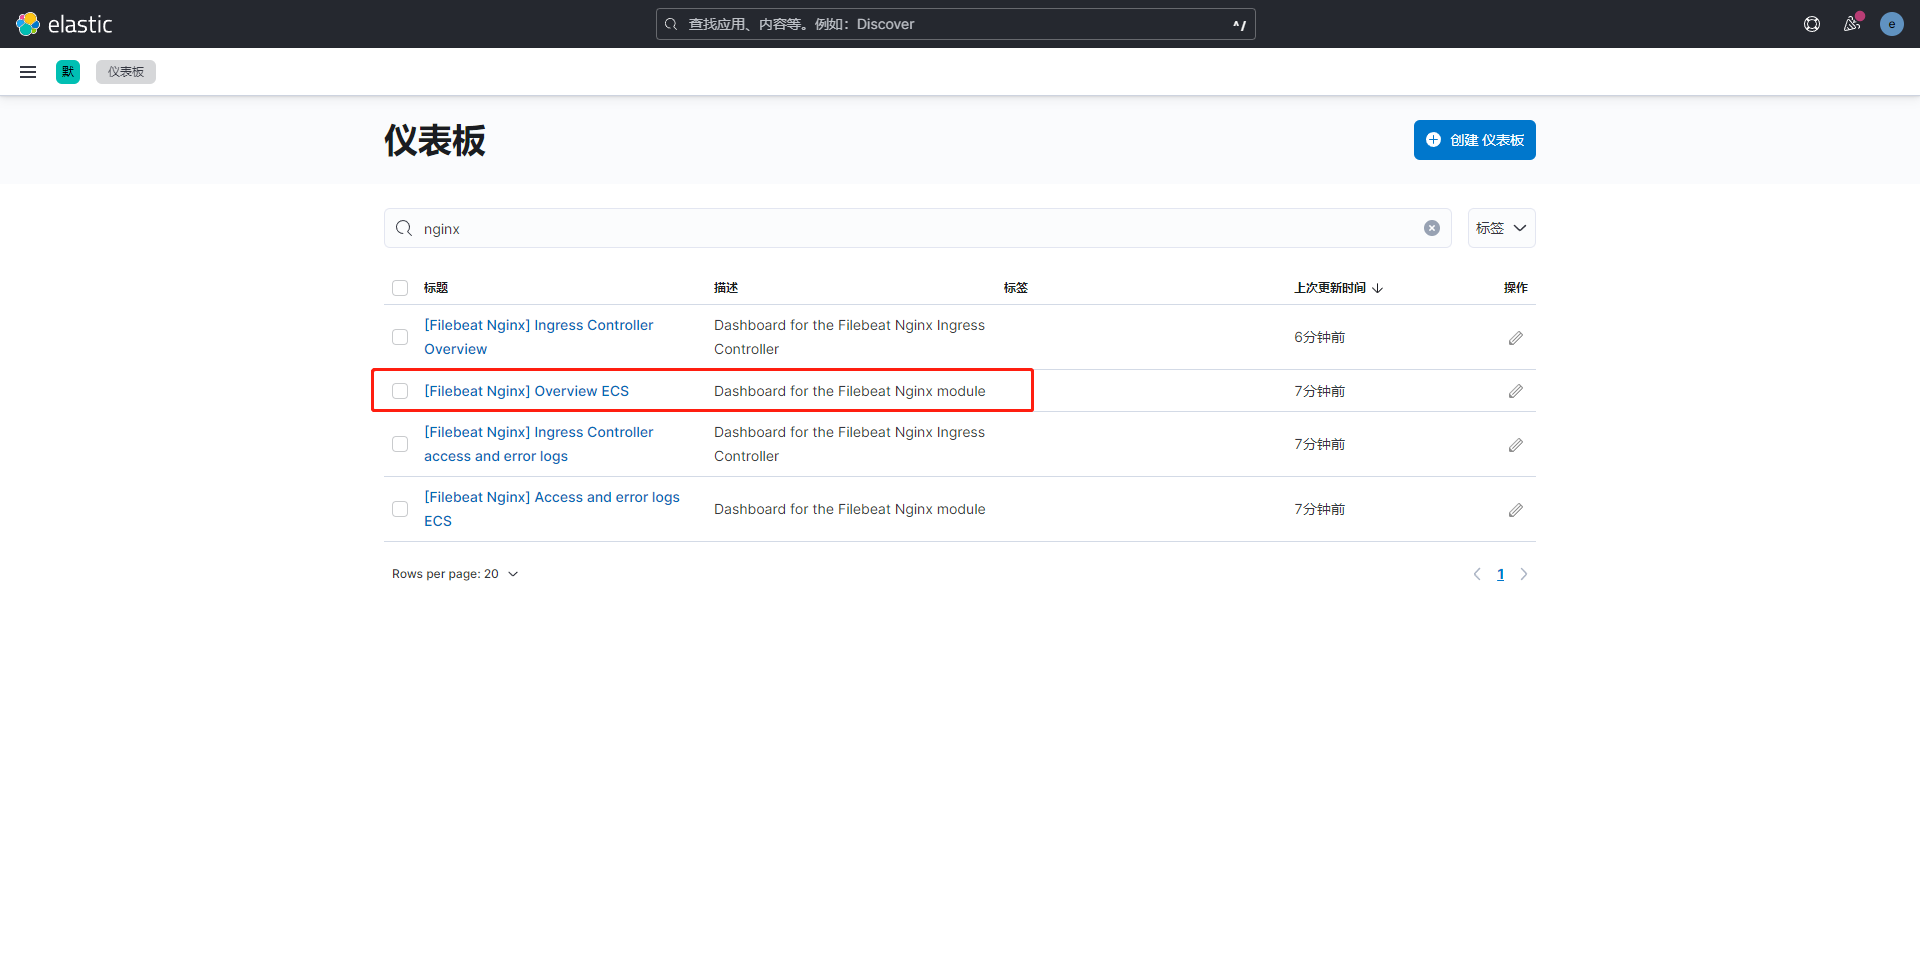
# 6、kibana查看数据
在kibana中会多出几个视图,即表示安装成功
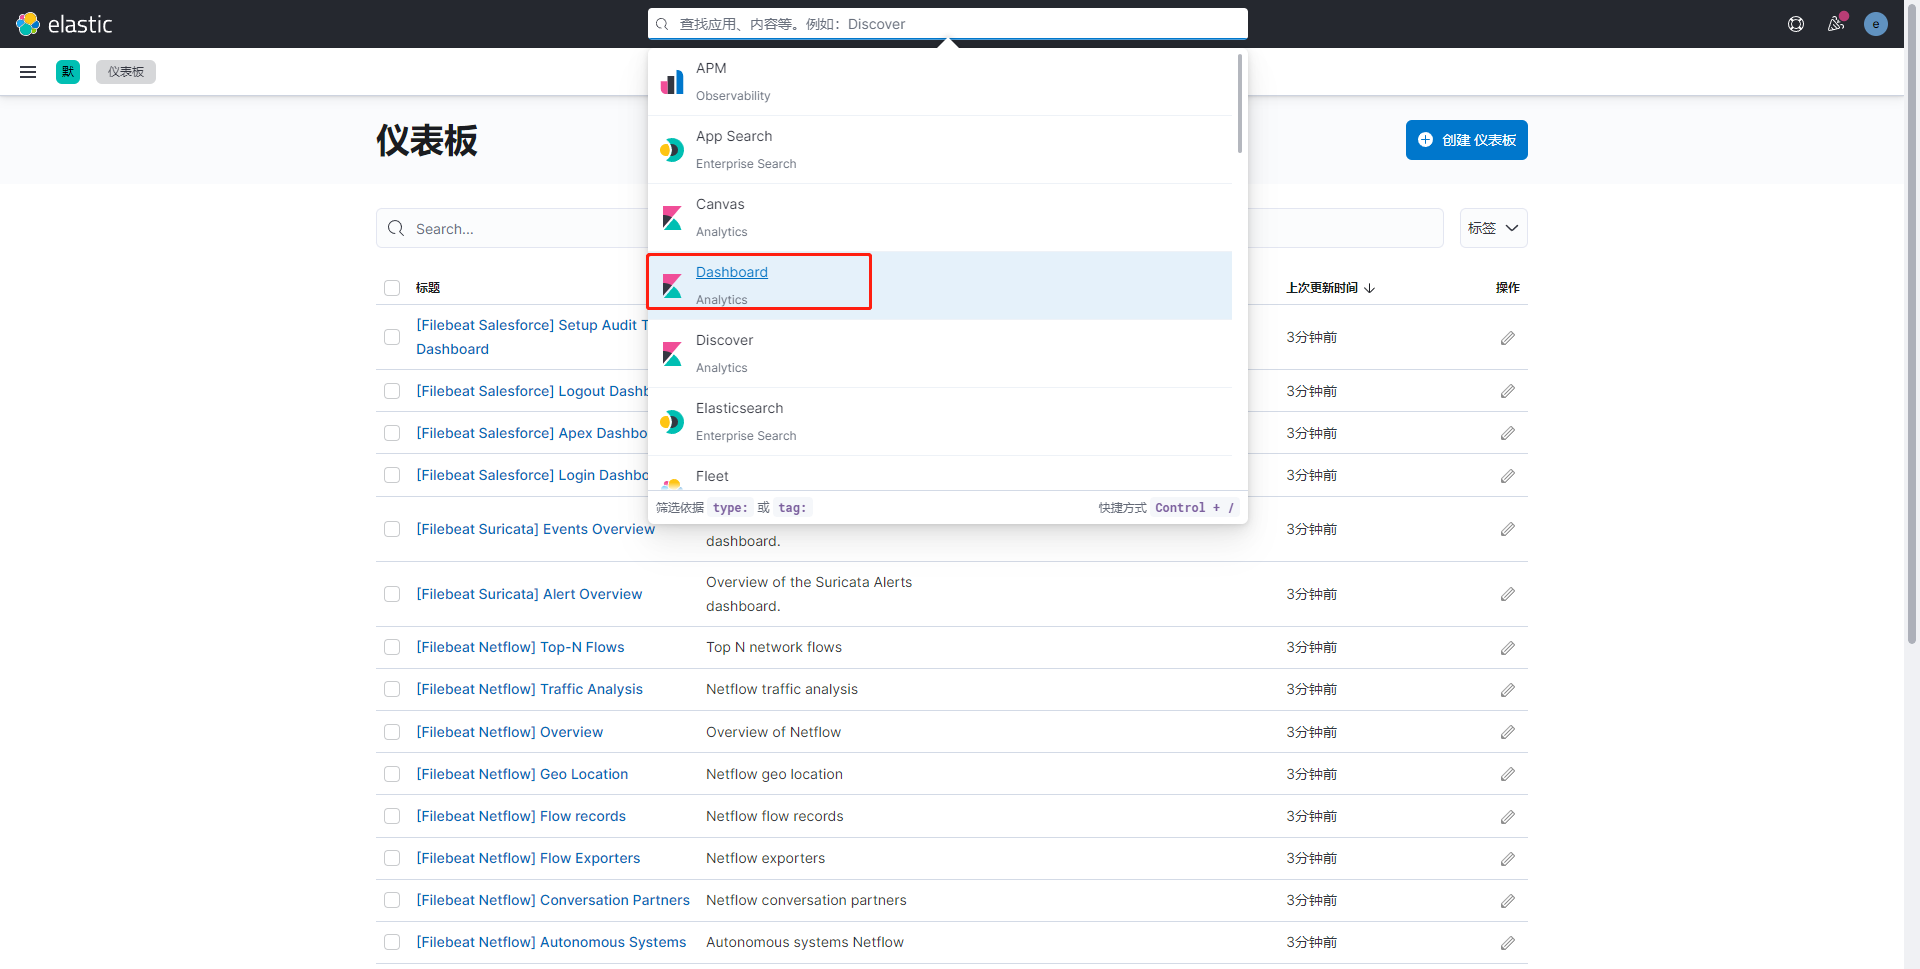
搜索nginx
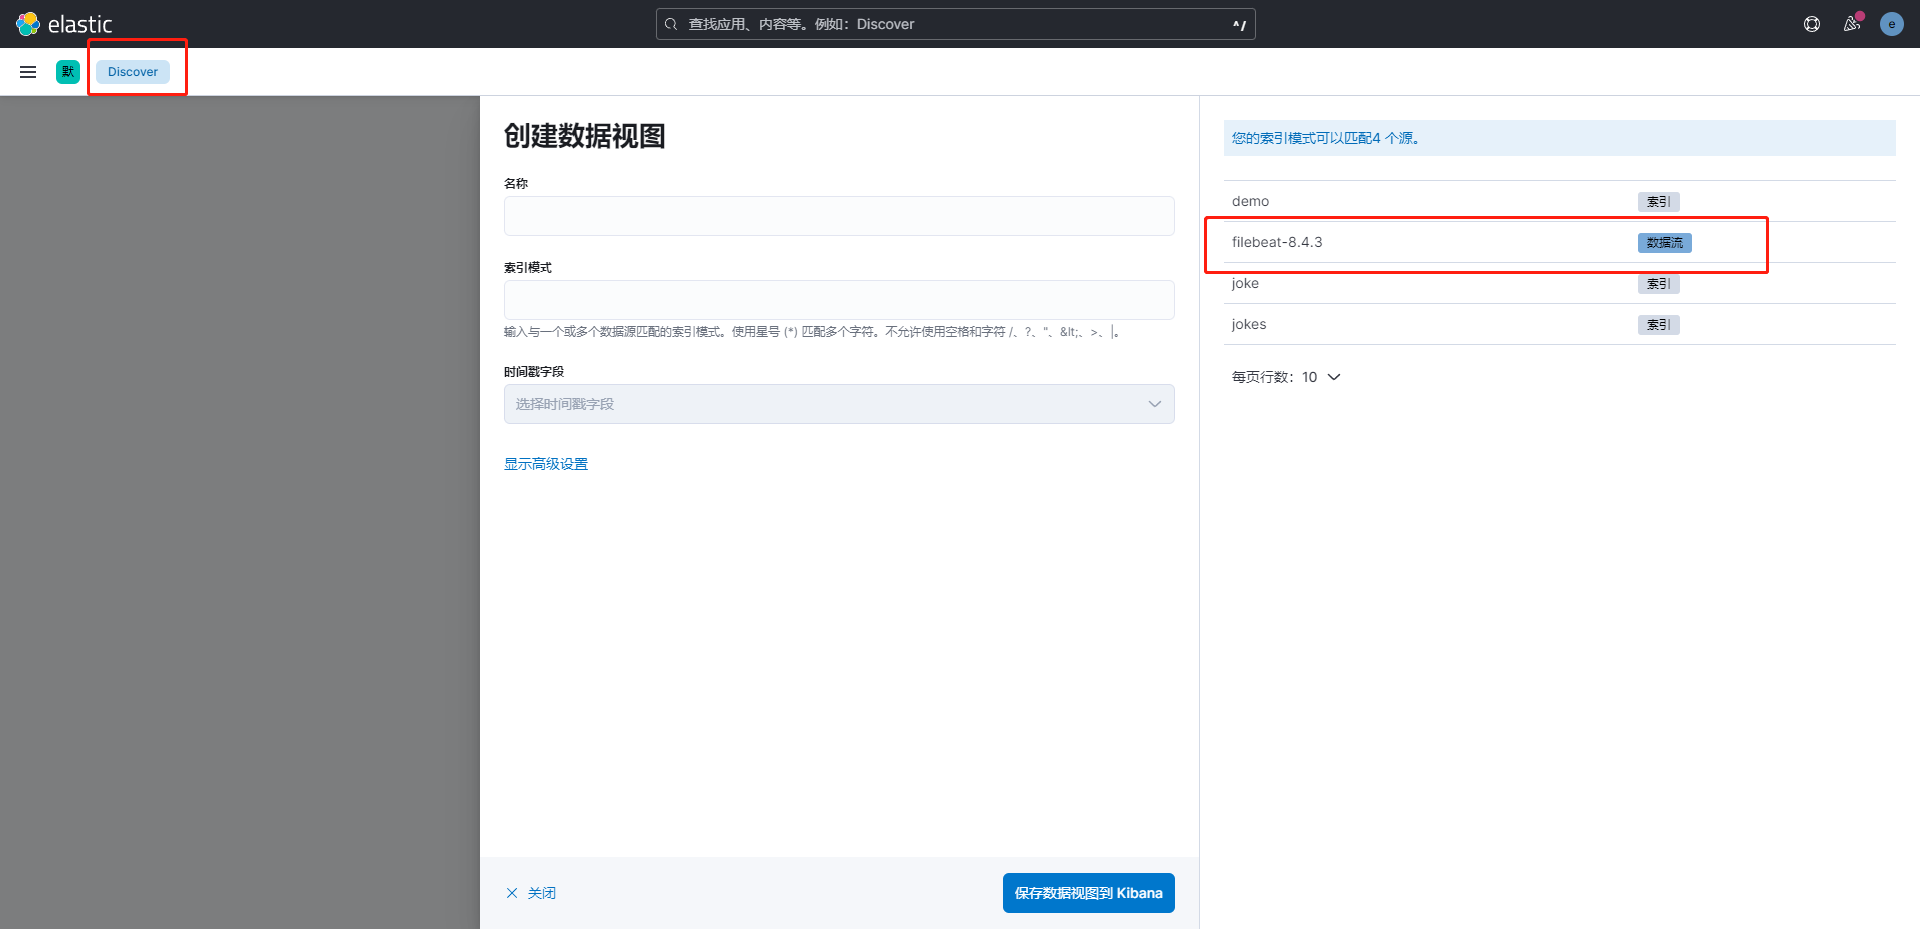
# kibann 配置filebeat
# 问题汇总
# 无法删除 filebeat 的index
进入kibana,删除 filebeat的数据流
# 如何从头开始读取
删除 filebeat目录下的 ./data/registry 文件内容即可
rm -rf ./data/registry
# Logstash
对提交的数据进行清洗
input
- file
- redis
- beat
filter
- grok:正则表达式,可将非机构化的数据转化为结构化的数据
- mutate :数据增删改查
- drop:删除
- date : 将字符串类型的时间字段转化为时间戳类型,方便后续数据处理
out
- stdout
- elasticsearch
基本配置
input {
  beats {
    port => 5044
  }
}
output {
  elasticsearch {
    hosts => ["http://192.168.110.130:9200"] #这里可以配置多个
    index => "query-%{yyyyMMdd}"
  }
}
# Metricbeat
指标(收集系统、进程和文件系统级别的CPU和内存使用情况等数据)
module : ningx
metricset: cpu memory network
redis-cli info
修改es的链接
启动
./metricbeat -e

# 后台运行
./metricbeat -e >/dev/null 2>&1 &

#查看
fg

# 放入后台
ctrl +z
开启nginx的状态查询
./configure --prefix=/usr/local/nginx --with-http_stub_status_module
# 配置 nginx 状态统计
location /nginx-status {
    stub_status on;
    access_log off;
}
启用nginx modules
./metricbeat modules enable|disable nginx
配置nginx module 地址 modules.d/nginx.yml
hosts: ["http://localhost"]
server_status_path: "nginx-status" // nginx 配置的状态查询一致
metricbeat配置kibana
setup.kibana:
	host:"kibana_host:5601"
metricbeat 安装仪表盘到kibana
./metricbeat setup
常见的状态
| 名称 | 示例 | 备注 |
|---|---|---|
| agent.hostname | ||
| log.file.path :日志文件路径 | ||
| source.ip :来源ip | ||
| http.request.method | ||
| user_agent.name 系统名称 | ||
| user_agent_os.version 系统版本 | ||
| user_agent.devive.name 设备名称 | ||
# Kibana配置账号密码
在 kibana.yml中配置用户名和密码
elasticsearch.username: "kibana"
elasticsearch.password: "*****"
账号密码为 es初始化中设置的密码 elastic
重启kibana
输入http://ip:5601打开登录页面,使用elastic账号登录,并在角色和用户管理中添加用户指定 索引用于访问ES.
# Logstash配置账号密码
在logstash.yml中配置用户名和密码
xpack.monitoring.enabled: true
xpack.monitoring.elasticsearch.username: logstash_system
xpack.monitoring.elasticsearch.password: *****
xpack.monitoring.elasticsearch.hosts: ["http://ip:9200"]
Api访问
http请求方式,在请求链接中添加账号和密码,注:密码中不要带@。
http://{userName}:{passwords}@ip:port
# logstash同步mysql 到es
# Sample Logstash configuration for creating a simple
# Beats -> Logstash -> Elasticsearch pipeline.

input {
  jdbc {
    jdbc_driver_library => "/home/orangbus/Code/Docker/Elk/Package/mysql-connector-java-8.0.28.jar"
    jdbc_driver_class => "com.mysql.cj.jdbc.Driver"
    jdbc_connection_string => "jdbc:mysql://127.0.0.1:3306/laravel9"
    jdbc_user => "root"
    jdbc_password => "root"
    jdbc_page_size => "1000"
    schedule => "* * * * *"
    statement => "SELECT * FROM brain_teasers WHERE updated_at >= :sql_last_value"
    use_column_value => true
    tracking_column_type => "timestamp"
    tracking_column => "updated_at"
#    last_run_metadata_path => "syncpoint_table"
  }
}

  output {
#    elasticsearch {
#      hosts => ["http://localhost:9200"]
#      index => "%{[@metadata][beat]}-%{[@metadata][version]}-%{+YYYY.MM.dd}"
      #user => "elastic"
      #password => "changeme"
#  }
  stdout {
    codec => json_lines
  }

}
jdbc_driver_library: jdbc mysql 驱动的路径,在上一步中已经下载jdbc_driver_class: 驱动类的名字,mysql 填com.mysql.jdbc.Driver就好了jdbc_connection_string: mysql 地址jdbc_user: mysql 用户jdbc_password: mysql 密码schedule: 执行 sql 时机,类似 crontab 的调度statement: 要执行的 sql,以 ":" 开头是定义的变量,可以通过 parameters 来设置变量,这里的sql_last_value是内置的变量,表示上一次 sql 执行中 update_time 的值,这里update_time条件是>=因为时间有可能相等,没有等号可能会漏掉一些增量use_column_value: 使用递增列的值tracking_column_type: 递增字段的类型,numeric表示数值类型,timestamp表示时间戳类型tracking_column: 递增字段的名称,这里使用 update_time 这一列,这列的类型是timestamplast_run_metadata_path: 同步点文件,这个文件记录了上次的同步点,重启时会读取这个文件,这个文件可以手动修改hosts: es 集群地址user: es 用户名password: es 密码index: 导入到 es 中的 index 名,这里我直接设置成了 mysql 表的名字document_id: 导入到 es 中的文档 id,这个需要设置成主键,否则同一条记录更新后在 es 中会出现两条记录,%{id}表示引用 mysql 表中id字段的值
启动
./bin/logstash -f config/mysql.yml